 EXECUTIVE SUMMARY
For the third consecutive year, global energy investment declined, to USD 1.8 trillion (United States dollars) in 2017 – a fall of 2% in real terms. The power generation sector accounted for most of this decline, due to fewer additions of coal, hydro and nuclear power capacity, which more than offset increased investment in solar photovoltaics (PV). Several sectors saw an increase in investment in 2017, including energy efficiency and upstream oil and gas. Nevertheless, capital spending on fossil fuel supply remained around two-thirds of that for 2014. The electricity sector was the largest recipient of global energy investment for the second year running, reflecting the ongoing electrification of world’s economy and supported by robust investment in networks and renewable power.
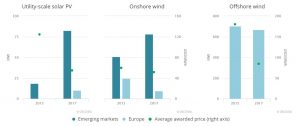
Falling costs continue to affect investment trends, prices and inter-fuel competition across several parts of the energy sector. Unit costs for solar PV projects, which represent 8% of total energy investment worldwide, fell by nearly 15% on average, thanks to lower module prices and a shift in deployment to lower-cost regions. Investment nonetheless rose to a record level. Technology improvements and government tendering schemes are facilitating economies of scale of new projects in some markets: in emerging economies outside of the People’s Republic of China (hereafter, “China”) the average size of awarded solar PV projects rose by 4.5 times over the five years through 2017, while that of onshore wind rose by half. Project economics in the oil and gas sector are complex, but costs for conventional oil and gas developments have not followed the trend of higher oil prices since mid-2016, thanks to cost discipline by operators and excess capacity in the services industry. In the United States shale sector, however, an upswing in activity led to an almost 10% increase in costs in 2017, and a similar rise is expected in 2018. New digital technologies are increasingly keeping costs under control across the entire energy sector, including in upstream oil and gas.
China remained the largest destination of energy investment, taking over one-fifth of the global total. China’s energy investment is increasingly driven by low-carbon electricity supply and networks, and energy efficiency. Investment in new coal-fired plants there dropped by 55% in 2017. The United States consolidated its position as the second-largest investing country, thanks to a sharp rebound in spending in the upstream oil and gas sector (mainly shale), on gas-fired plants and electricity grids. Europe’s share of global energy investment was around 15%, with a boost in spending on energy efficiency and a modest increase in renewables investment offset by declines in thermal generation. In India, investment in renewable power topped that for fossil fuel-based power generation for the first time in 2017.
PUTTING ENERGY INVESTMENT IN A BROADER CONTEXT
There was a pause in the shift of investments towards cleaner sources of energy supply. The share of fossil fuels, including thermal power generation, in energy supply investment rose slightly to 59% as spending in upstream oil and gas increased modestly. The International Energy Agency (IEA) Sustainable Development Scenario (SDS) sees the share of fossil fuels in energy supply investment falling to 40% by 2030. Mature economies and China, with a fossil fuel share of supply investment at 55%, have seen faster change than emerging economies, where the share stands at 65%, but all three regions saw an uptick in 2017. Clean energy supply investment has grown fastest in the power sector. The share of clean power sources (renewables and nuclear) in generation investment was over 70% in 2017, up from less than 50% a decade ago, though this stems partly from lower coal-fired power investment. Greater spending on electricity networks and battery storage are also contributing to a more flexible power system, which is crucial to the integration of higher shares of solar PV and wind generation. Investment in all forms of clean power, as well as in networks, would need to rise substantially under the SDS.
Investment in electrification of transport and heating continued to show exponential growth in 2017, but investments in the direct use of renewables in transport and heat remain weak. The USD 43 billion that consumers spent on electric passenger vehicles (plug-in hybrids and pure battery vehicles) in 2017 pushed up the electric vehicle (EV) market share to more than one in every one hundred passenger vehicles sold and was responsible for half of the global growth in passenger vehicle sales. However, the permanent impact of these EV sales on oil demand remains small: a reduction of just 30 000 barrels per day compared with 1.6 million barrels per day of global oil demand growth in 2017. The impact of the biofuels production capacity coming online in 2017 will be lower still. Global spending on energy efficiency in heating, ventilation, and air conditioning experienced double-digit growth, with sales of heat pumps in particular rising by 30%. Like EVs, heat pumps are more efficient than their traditional alternatives and can help low-carbon electricity to penetrate higher shares of energy demand, yet they make up only around 2.5% of total sales of heating equipment. Most of the market is dedicated to fossil fuel-burning technologies. Investments in solar thermal heating installations, at USD 18 billion, declined for the fourth consecutive year. These trends are having no discernible impact on the allocation of capital to oil and gas supply projects.
ENERGY END-USE AND EFFICIENCY
Spending related to energy efficiency improvements remained relatively immune from the overall downward trend in energy investment worldwide. A total of USD 236 billion was invested in energy efficiency across buildings, transport and industry in 2017. However, while growth of investment in energy efficiency has been strong in recent years, it slowed to 3%, against a backdrop in which energy efficiency policy implementation and global energy intensity improvements are slowing. The increase in 2017 was led by spending on heating, cooling and lighting efficiency in buildings, boosted by standardisation of projects that can be used in different building types. Guaranteed energy savings from standard lighting retrofits, in particular, are becoming familiar to financial lenders, who are prepared to lend more cheaply. In total, buildings sector energy efficiency spending rose 3%, largely due to an increase in total construction sector activity. Investment in energy efficiency in the industrial sector is estimated to have declined 8% in 2017, partly due to a slowdown in new facilities being constructed in China. In the steel sector, this slowdown has been dramatic, and as investment in coal-based steel production has collapsed, the average energy intensity of new capacity has improved by 10%.
In 2017, green bonds issued primarily for energy efficiency uses exceeded the value of those issued primarily for renewables and other energy uses for the first time. The value of green bonds issued primarily for energy efficiency uses nearly tripled to USD 47 billion. In addition, green banks, established by public authorities to stimulate investment in projects for sustainability, are also lending a higher share of their funds to energy efficiency projects. These trends reflect an emerging diversification of funding sources for energy efficiency, which remain dominated by balance sheet finance. Energy service companies – with a global market size of around USD 27 billion – are playing a particularly important role in developing financing models to lower costs for replicable energy efficiency projects, including the adoption of energy savings insurance. In certain countries, policy makers have given energy companies incentives to seek the lowest-cost energy efficiency projects via markets for tradable energy savings (white certificates). In 2017, prices on those markets in France and Italy reached record levels. Overall, investment in energy efficiency is closely linked to government policies, and there is room to tighten standards and encourage higher spending.
ELECTRICITY AND RENEWABLES
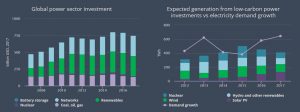
The relationship between electricity demand and investment continues to evolve, with the power sector becoming more capital intensive. Over the past decade, the ratio of global power sector investment to demand growth more than doubled on average with policies to encourage renewables and efforts to upgrade and expand grids, but also due to more energy efficiency dampening demand growth. The share of investment in less capital-intensive thermal generation has generally declined over time. In 2017, global power sector investment fell by 6% to near USD 750 billion in 2017, mainly the result of a 10% slump in the commissioning of new generation capacity. Half of the drop was due to coal-fired power plants, driven by China and India. Retirements of existing coal-fired power capacity – mainly inefficient subcritical plants – offset nearly half of the additions. Investment in gas-fired generation capacity rose by nearly 40%, led by the United States and the Middle East/North Africa. There are indications of lower investment in both these sources of generation in the years ahead. Final investment decisions for gas power plants fell by 23% in 2017, while those for coal dropped by 18% to a level only one-third of that in 2010.
Although it declined by 7%, investment in renewable power, at nearly USD 300 billion, accounted for two-thirds of power generation spending in 2017. Investment was supported by record spending for solar PV, of which nearly 45% was in China. Offshore wind investment also reached record levels, with the commissioning of nearly 4 gigawatts, mostly in Europe. On the other hand, onshore wind investment fell by nearly 15%, largely due to the United States, China, Europe and Brazil, though one-third of this decline was from falling investment costs. Investment in hydropower fell to its lowest level in over a decade, with a slowdown in China, Brazil and Southeast Asia. Recent policy changes seeking to promote more cost-effective solar PV development in China raise the risk of a continued slowdown in renewables investment, even as prospects remain strong in other markets.
Robust investment in renewable power is even more important for boosting low-carbon power generation in light of a sharp fall in investment in new nuclear power, which declined to its lowest level in five years. Construction starts for new nuclear plants remain muted, while in some regions, retirements of existing plants are reducing the impact of the growth in renewables. In Europe, the decline in nuclear generation since 2010 has offset over 40% of the growth in solar PV and wind output there. Nevertheless, global spending on lifetime extensions for existing nuclear plants rose in 2017, potentially providing a cost-effective transitional measure for supporting low-carbon generation.
Global spending on the electricity network grew more slowly in 2017, at 1%, to top USD 300 billion. Spending reached a new high, and the grid’s share of power-sector investment rose to 40% – its highest level in a decade. China remained the largest market for grid investment, followed by the United States. Investment is rising in technologies designed to enhance the flexibility of power systems and support the integration of variable renewables and new sources of demand. Power companies are modernising electricity grids by spending more on, and acquiring businesses related to, so-called smart grid technology, including smart meters, advanced distribution equipment and EV charging, which accounted for over 10% of networks spending. Although investment in stationary battery storage fell by over 10% to under USD 2 billion, it was six times higher than in 2012.
FOSSIL FUEL SUPPLY
Investment in fossil fuel supply stabilised around USD 790 billion in 2017 as reduced spending in coal supply and in liquefied natural gas (LNG) offset a modest rise in upstream oil and gas. Upstream investment rose by 4% to USD 450 billion in 2017 and is set to rise by 5% to USD 472 billion (in nominal terms) in 2018, driven by the US shale sector, which is expected to grow by around 20%. Investment in conventional oil and gas remains subdued, focusing on brownfield projects, and the share of greenfield projects in total upstream investment is expected to plunge to about one-third in 2018 – the lowest level for several years. Despite the more-than-doubling of thermal coal prices since early 2016, investment in coal supply declined by 13% in 2017 to just below USD 80 billion, mainly due to reduced spending in China. The threat of tougher policy action to address climate change and air pollution and enhanced competition from renewables continue to discourage investment in coal. Investment in LNG liquefaction plants continues to plunge and is expected to fall to around USD 15 billion 2018, as only three new LNG projects have been sanctioned since mid-2016.
The oil and gas industry is shifting towards short-cycle projects and rapidly declining producing assets while expanding into the downstream sector and petrochemicals. While the recovery in upstream investment is not homogeneous, most companies continue to prioritise cost control, financial discipline and returns to shareholders. They appear to be aiming to reduce exposure to long-term risks, expanding their activities in smaller projects that generate faster payback, such as shale and brownfields. Global investment in shale is expected to reach a record of almost one-quarter of total upstream spending in 2018. At the same time, oil and gas companies are increasing their investments outside the upstream sector. Global investment in oil refining increased by 10% in 2017. Investment in petrochemicals rose by 11% to USD 17 billion in 2017, set to reach almost USD 20 billion in 2018. For the first time in recent decades, the United States was the largest recipient of investment in petrochemicals.
Higher prices and operational improvements are putting the US shale sector on track to achieve positive free cash flow in 2018 for the first time ever. Risks to the financial health of the sector remain, including inflationary pressures and pipeline bottlenecks in the Permian Basin. Since 2010, the sector has constantly spent more than it has earned, generating cumulative negative free cash flow of about USD 250 billion. This has forced it to rely largely on external source of financing. Following a very turbulent 2015-16 period, the sector appears to be benefiting from huge technological and operational advances, as well as higher prices and a more cautious approach to investment. Growing investments by the majors in the sector, tripling in only two years to 18% of their 2018 planned upstream oil spending, could boost prospects for the sector, thanks to economies of scale and technical improvements, including the increased use of digital technologies. Although in decline, the leverage of US shale companies remains high, but the average interest rate paid to service their debt – at around 6% – has been broadly stable as capital markets reward the improvement in sector’s financial health.
The rollercoaster journey of oil prices in recent years has not fundamentally changed the way the oil and gas industry finances its operations. The industry generally is now on more solid financial footing, thanks to higher oil prices, continuing financial discipline and cost reductions. In the first quarter of 2018, majors achieved the highest level of free cash flow since the same period in 2012 and are starting to reduce leverage, which skyrocketed over 2014-17. The largest 20 institutional equity holders in the oil and gas majors are continuing to expanding their stakes, which in aggregate rose from 24% in 2014 to 27% in 2017, encouraged by high and stable dividends.
KEY TRENDS IN FINANCING AND FUNDING
While corporations continue to provide the bulk of primary finance for energy investments, there are signs of diversification of financing options in some sectors. With higher oil prices and better cost control, the financial health of the oil and gas companies has improved markedly, enabling the majors to better self-finance projects and US shale companies to raise funds with cheaper debt. In the power sector, the perceived maturity and reliability of renewable technologies and better risk management of renewables projects has facilitated the expansion of off-balance sheet structures outside of the United States and Europe, with project finance rising in Asia, Latin America and Africa. This trend is supported in part by public financial institutions, such as development banks, which can reduce risks for commercial finance. In Europe, better debt financing terms have helped lower generation costs for new offshore wind by nearly 15% in the past five years. Improvements in standardisation, aggregation and credit assessment for small-scale projects facilitated record issuance of green bonds of USD 160 billion in 2017. This is helping developers of energy efficiency and distributed solar PV projects to gain access to finance from the capital markets and EV buyers to get loans from banks.
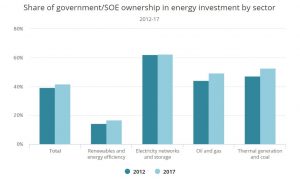
The share of private-led energy investment has declined in the past five years. There is a rising share of investment in renewables, where private entities own nearly three-quarters of investments, energy efficiency, which is dominated by private spending, and private-led grid spending. However, the share of energy investment from state-owned enterprises (SOEs) rose by more over the period. Fossil fuel supply and thermal power investments are increasingly dominated by SOEs. In 2017, the share of national oil companies in total oil and gas investment remained near record highs, while the share of SOEs in thermal generation investment rose to 55%. In the case of new nuclear plants, all investment is made by SOEs. Most investment decisions for the largest thermal plants in emerging economies involve a public financial institution (export credit agency or national bank), reflecting risk profiles. SOEs contribute over 60% of electricity grid spending, and this share has remained stable over the past five years. Government-backed entities also play key roles in some renewable projects, such as hydropower, and energy efficiency for public buildings.
Investment decisions in some sectors are increasingly affected by government policies. In the power sector, over 95% of global investment is made by companies whose revenues are fully regulated or affected by mechanisms to manage the risk associated with variable prices on competitive wholesale markets. Networks investment is very sensitive to regulation of retail and use-of-system tariffs, which determine the ability of utilities to recover their costs. In some emerging economies, regulated tariffs are still too low to ensure the financial viability of the power system and support investment. Utilities in mature electricity markets are finding that their thermal power generation assets exposed to wholesale market pricing are becoming less profitable or even unprofitable and are seeking profitable opportunities in other areas, such as renewables and networks. While most renewables investment depends on contracts and regulated instruments, over 35% of utility-scale investment is underpinned by competitive mechanisms, such as auctions, to set prices. Outside China, this share reached a record 50%. Most energy efficiency investments are underpinned by energy performance standards, and a growing amount involve financial incentives. Government purchase incentives for electric cars represented 24% of the global spending on electric car sales in 2017 and their combined value is growing at 55% per year.
INNOVATION AND NEW TECHNOLOGIES
Government energy research and development (R&D) spending increased by around 8% in 2017, reaching a new high of USD 27 billion. Most of the growth came from spending on low-carbon technologies, which is estimated to have risen 13%, which is welcome after several years of stagnation. Low-carbon energy technologies account for three-quarters of public energy R&D spending. On average, governments allocate around 0.1% of their total public spending to energy R&D, a level that has remained stable in recent years. IEA tracking of corporate energy R&D investment shows that this grew in 2017 by 3% to USD 88 billion, with faster growth in low-carbon sectors. A major contributor to this growth was the automotive sector, driven by intense technological competition, notably in EVs and new forms of mobility. Venture capital (VC) investment in low-carbon energy fell to USD 2.1 billion in 2017, following a spike in big deals in low-carbon transport in 2016. The longer-term trend is nonetheless positive. Recent growth has been driven almost entirely by clean transportation investments, but digital efficiency technology is attracting more funding. Renewables hardware VC investment remains lower than 2014.
New approaches to boosting investment in carbon capture, utilisation and storage (CCUS) are needed for the world to be on track to meet its climate change goals. Only around 15% of the USD 28 billion earmarked for large CCUS projects since 2007 was actually spent, because commercial conditions and regulatory certainty have not attracted private investment alongside available public funds. However, investment may pick up with the stronger incentives for carbon dioxide (CO2) storage set out in a revised US tax credit. Building on this type of policy approach, this report estimates that a dedicated commercial incentive as low as USD 50 per tonne of CO2 sequestered could trigger investment in the capture, utilisation and storage of over 450 million tonnes of CO2 globally in the near term. This is equal to the global growth in CO2 emissions in 2017 and would increase the amount of carbon captured and stored by 15 times compared with today.
Electric batteries are increasingly being deployed across the energy sector, but their impact will largely depend on cost trends, which will be strongly influenced by investments outside the energy sector. Investment in lithium mining has risen almost tenfold since 2012, and investment in battery manufacturing capacity has risen more than fivefold. Bottlenecks and supply risks will be avoided only if investments throughout the value chain, including EV factories, are aligned. To help this, governments can set clear policies for the market to follow. A record number of investment decisions were taken in 2017 to build electrolysers to make hydrogen for clean energy applications. While investment remains well below that in electric batteries for stationary storage and road vehicles, interest in hydrogen projects is growing.
RESULTS
Total energy investments continue to be increasingly supported by governments.

The energy sector is shifting towards more capital incentives.

In emerging markets, the auctions support bigger renewable projects.

Source: “International Energy Agency World Energy Investment”, 2018
